Deploying Fluent Bit in EKS for CloudWatch Logs: A Comprehensive Guide

👋 Welcome to my Hashnode profile! I'm a passionate technologist with expertise in AWS, DevOps, Kubernetes, Terraform, Datree, and various cloud technologies. Here's a glimpse into what I bring to the table: 🌟 Cloud Aficionado: I thrive in the world of cloud technologies, particularly AWS. From architecting scalable infrastructure to optimizing cost efficiency, I love diving deep into the AWS ecosystem and crafting robust solutions. 🚀 DevOps Champion: As a DevOps enthusiast, I embrace the culture of collaboration and continuous improvement. I specialize in streamlining development workflows, implementing CI/CD pipelines, and automating infrastructure deployment using modern tools like Kubernetes. ⛵ Kubernetes Navigator: Navigating the seas of containerization is my forte. With a solid grasp on Kubernetes, I orchestrate containerized applications, manage deployments, and ensure seamless scalability while maximizing resource utilization. 🏗️ Terraform Magician: Building infrastructure as code is where I excel. With Terraform, I conjure up infrastructure blueprints, define infrastructure-as-code, and provision resources across multiple cloud platforms, ensuring consistent and reproducible deployments. 🌳 Datree Guardian: In my quest for secure and compliant code, I leverage Datree to enforce best practices and prevent misconfigurations. I'm passionate about maintaining code quality, security, and reliability in every project I undertake. 🌐 Cloud Explorer: The ever-evolving cloud landscape fascinates me, and I'm constantly exploring new technologies and trends. From serverless architectures to big data analytics, I'm eager to stay ahead of the curve and help you harness the full potential of the cloud. Whether you need assistance in designing scalable architectures, optimizing your infrastructure, or enhancing your DevOps practices, I'm here to collaborate and share my knowledge. Let's embark on a journey together, where we leverage cutting-edge technologies to build robust and efficient solutions in the cloud! 🚀💻
Logging is a critical aspect of managing containerized applications in Kubernetes. Efficiently collecting, analyzing, and storing logs can provide valuable insights into the performance and health of your applications. In this guide, we will walk you through the process of setting up Fluent Bit as a DaemonSet to send logs to CloudWatch Logs in an Amazon EKS or Kubernetes environment.
Introduction to Fluent Bit
Fluent Bit is an open source and multi-platform log processor and forwarder that allows you to collect data and logs from different sources, and unify and send them to different destinations including CloudWatch Logs. It’s also fully compatible with Docker and Kubernetes environments. Using the newly launched Fluent Bit daemonset, you can send container logs from your EKS clusters to CloudWatch logs for logs storage and analytics.

Differences between Fluentd and Fluent Bit Configurations
If you're already using Fluentd to send logs from containers to CloudWatch Logs, it's crucial to understand the differences between Fluentd and Fluent Bit configurations. AWS offers two default configurations for Fluent Bit, each serving a specific purpose.
1. Fluent Bit Optimized Configuration
The Fluent Bit optimized configuration is tailored to align with Fluent Bit best practices. Here are the key distinctions compared to Fluentd:
Log Stream Names
Under /aws/containerinsights/Cluster_Name/application:
Fluent Bit Optimized Configuration: Sends logs to
kubernetes-nodeName-application.var.log.containers.kubernetes-podName_kubernetes-namespace_kubernetes-container-name-kubernetes-containerIDFluentd: Sends logs to
kubernetes-podName_kubernetes-namespace_kubernetes-containerName_kubernetes-containerID
Under /aws/containerinsights/Cluster_Name/host:
Fluent Bit Optimized Configuration: Sends logs to
kubernetes-nodeName.host-log-fileFluentd: Sends logs to
host-log-file-Kubernetes-NodePrivateIp
Under /aws/containerinsights/Cluster_Name/dataplane:
Fluent Bit Optimized Configuration: Sends logs to
kubernetes-nodeName.dataplaneServiceLogFluentd: Sends logs to
dataplaneServiceLog-Kubernetes-nodeName
Log File Locations
For kube-proxy and aws-node log files in Container Insights, Fluentd places them in
/aws/containerinsights/Cluster_Name/application.In the Fluent Bit optimized configuration, they are in
/aws/containerinsights/Cluster_Name/dataplane.
Metadata Differences
Most metadata such as
pod_nameandnamespace_nameis consistent between Fluent Bit and Fluentd.Specific differences:
Fluent Bit optimized configuration uses
docker_id, while Fluentd usesDocker.container_id.Both Fluent Bit configurations exclude certain metadata present only in Fluentd:
container_image_id,master_url,namespace_id, andnamespace_labels.
2. Fluentd-Compatible Configuration
The Fluentd-compatible configuration aims to align with Fluentd behavior as closely as possible. It's an alternative configuration choice for users familiar with Fluentd. The distinctions are similar to the Fluent Bit optimized configuration, ensuring flexibility in configuration options.
Setting up Fluent Bit
Prerequisites
Ensure the IAM role attached to cluster nodes has sufficient permissions.
Add CloudwatchLogsFullAccess Permission.
Review Amazon EKS IAM Policies, Roles, and Permissions.
Namespace creation
If the 'amazon-cloudwatch' namespace doesn't exist, create it using the following command:
kubectl apply -f https://raw.githubusercontent.com/aws-samples/amazon-cloudwatch-container-insights/latest/k8s-deployment-manifest-templates/deployment-mode/daemonset/container-insights-monitoring/cloudwatch-namespace.yaml
ConfigMap creation
Create a ConfigMap named 'fluent-bit-cluster-info' with cluster details and desired Fluent Bit settings:
ClusterName=cluster-name
RegionName=cluster-region
FluentBitHttpPort='2020'
FluentBitReadFromHead='Off'
[[ ${FluentBitReadFromHead} = 'On' ]] && FluentBitReadFromTail='Off'|| FluentBitReadFromTail='On'
[[ -z ${FluentBitHttpPort} ]] && FluentBitHttpServer='Off' || FluentBitHttpServer='On'
kubectl create configmap fluent-bit-cluster-info \
--from-literal=cluster.name=${ClusterName} \
--from-literal=http.server=${FluentBitHttpServer} \
--from-literal=http.port=${FluentBitHttpPort} \
--from-literal=read.head=${FluentBitReadFromHead} \
--from-literal=read.tail=${FluentBitReadFromTail} \
--from-literal=logs.region=${RegionName} -n amazon-cloudwatchDeploying Fluent Bit DaemonSet
In the provided command, the FluentBitHttpServer for monitoring plugin metrics is enabled by default. If you wish to disable it, you can do so by modifying the third line of the command. Change FluentBitHttpPort='' (an empty string) in the command.
Additionally, Fluent Bit, by default, reads log files from the tail, capturing only new logs after deployment. If you prefer the opposite behavior, where Fluent Bit collects all logs in the file system, set FluentBitReadFromHead='On'.
These adjustments provide flexibility in configuring Fluent Bit based on your monitoring and log collection preferences.
Choose either Fluent Bit optimized configuration or Fluentd-compatible configuration:
For Fluent Bit optimized configuration:
kubectl apply -f https://raw.githubusercontent.com/aws-samples/amazon-cloudwatch-container-insights/latest/k8s-deployment-manifest-templates/deployment-mode/daemonset/container-insights-monitoring/fluent-bit/fluent-bit.yaml
For Fluentd-compatible configuration:
kubectl apply -f https://raw.githubusercontent.com/aws-samples/amazon-cloudwatch-container-insights/latest/k8s-deployment-manifest-templates/deployment-mode/daemonset/container-insights-monitoring/fluent-bit/fluent-bit-compatible.yaml
Validation
Ensure Fluent Bit pods are running:
kubectl get pods -n amazon-cloudwatch
Upon following the aforementioned steps, the following resources are created within your Kubernetes cluster:
Service Account: Fluent-Bit
- A service account named
Fluent-Bitis established in theamazon-cloudwatchnamespace. This service account is specifically designated for running the Fluent Bit daemonSet. For a detailed understanding of managing service accounts, refer to the Managing Service Accounts section in the Kubernetes Reference documentation.
- A service account named
Cluster Role: Fluent-Bit-role
- In the
amazon-cloudwatchnamespace, a cluster role namedFluent-Bit-roleis instantiated. This cluster role is configured to grant essential permissions such as get, list, and watch on pod logs to theFluent-Bitservice account. For an in-depth exploration of cluster roles and associated permissions, consult the API Overview section in the Kubernetes Reference documentation.
- In the
ConfigMap: Fluent-Bit-config
- Another crucial component, a ConfigMap titled
Fluent-Bit-config, is generated within theamazon-cloudwatchnamespace. This ConfigMap encapsulates the configuration settings to be utilized by Fluent Bit. For detailed insights into configuring pods using ConfigMaps, refer to the Configure a Pod to Use a ConfigMap section in the Kubernetes Tasks documentation.
- Another crucial component, a ConfigMap titled
Verifying Fluent Bit Setup in CloudWatch
To ensure that Fluent Bit is correctly set up and sending logs to CloudWatch, follow these verification steps:
Access the CloudWatch Console:
- Open the CloudWatch console.
Navigate to Log Groups:
- In the navigation pane, select "Log groups."
Confirm the Region:
- Ensure that you are in the correct AWS Region where you deployed Fluent Bit.
Check Log Groups:
Examine the list of log groups in the Region. You should observe the following entries:
/aws/containerinsights/Cluster_Name/application/aws/containerinsights/Cluster_Name/host/aws/containerinsights/Cluster_Name/dataplane
Inspect Last Event Time:
Navigate to any of these log groups and check the "Last Event Time" for the log streams.
If the last event time is recent relative to the deployment time of Fluent Bit, it indicates that the setup is verified.
Note on /dataplane Log Group:
- Be aware that there might be a slight delay in creating the
/dataplanelog group. This delay is normal, as these log groups are generated only when Fluent Bit initiates the sending of logs for that specific log group.
- Be aware that there might be a slight delay in creating the
(Optional) Reducing the log volume from Fluent Bit
To reduce log volume, consider stopping Fluent Bit application logs or removing Kubernetes metadata:
Stop Fluent Bit application logs by removing the following section from 'Fluent-Bit.yaml':
[INPUT]
Name                tail
Tag                 application.*
Path                /var/log/containers/fluent-bit*
Parser              docker
DB                  /fluent-bit/state/flb_log.db
Mem_Buf_Limit       5MB
Skip_Long_Lines     On
Refresh_Interval    10
To stop Fluent Bit application logs, remove the following section from the Fluent-Bit.yaml file.
application-log.conf: |
    [FILTER]
    Name                nest
    Match               application.*
    Operation           lift
    Nested_under        kubernetes
    Add_prefix          Kube.

    [FILTER]
    Name                modify
    Match               application.*
    Remove              Kube.<Metadata_1>
    Remove              Kube.<Metadata_2>
    Remove              Kube.<Metadata_3>

    [FILTER]
    Name                nest
    Match               application.*
    Operation           nest
    Wildcard            Kube.*
    Nested_under        kubernetes
    Remove_prefix       Kube.
Troubleshooting
If you encounter issues, follow these troubleshooting steps:
Check Fluent Bit pod status:
kubectl get pods -n amazon-cloudwatchAddress IAM permission errors.
Resolve pod creation errors:
kubectl describe pod pod_name -n amazon-cloudwatch
Fluent Bit Monitoring and Log Analysis with CloudWatch Dashboard
In Container Insights, the integration of Fluent Bit brings forth significant advancements, including the introduction of a dedicated CloudWatch dashboard tailored for monitoring the health and performance of your logging components, particularly Fluent Bit.
Importance of Logging Health Monitoring
Monitoring the health of your logging architecture is a critical aspect often underestimated. The logging infrastructure plays a pivotal role in gaining visibility into your business-critical applications. Performance degradation or interruptions in log processing can lead to the loss of essential logs or result in inconsistencies. Such risks can directly impact the availability of your Kubernetes-based application or lead to non-compliance with regulations and business requirements. To address this, Container Insights now offers an optional CloudWatch dashboard specifically designed for Fluent Bit. This dashboard monitors real-time health and throughput performance and facilitates the creation of optional CloudWatch alarms.
Leveraging Fluent Bit Metrics with CloudWatch
Fluent Bit includes a built-in HTTP server capable of querying internal information and, notably, exposing Prometheus-style metrics via /api/v1/metrics/prometheus for each running plugin and Kubernetes worker node. By utilizing these exposed metrics, Container Insights, in conjunction with the CloudWatch Agent running on every EKS worker node as a daemonset, publishes custom metrics to CloudWatch, including:
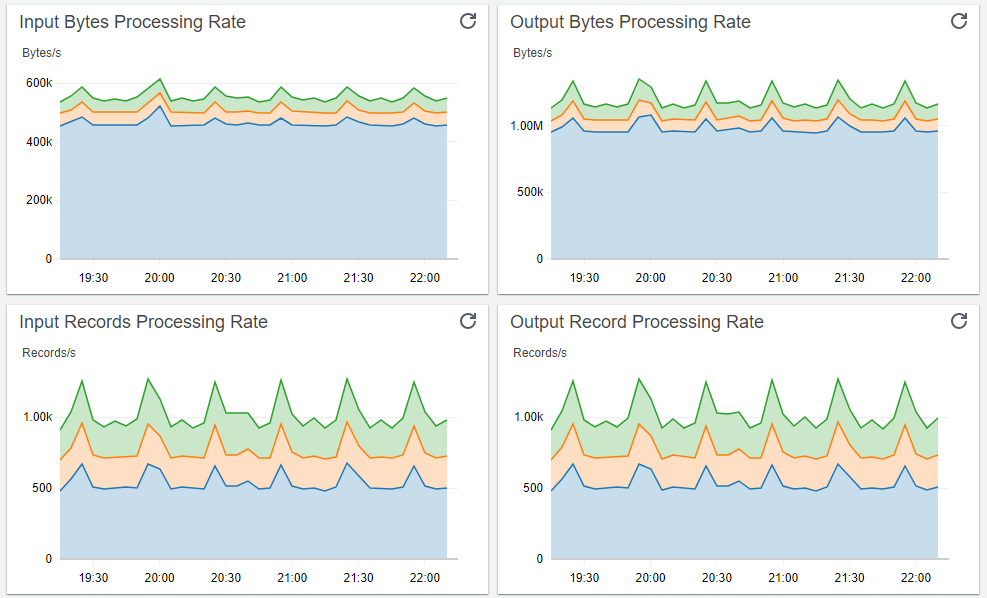
Input Bytes Processing Rate
Input Records Processing Rate
Output Retry/Failed Rates
Output Bytes Processing Rate
Output Record Processing Rate
Output Error Rate
Creating the CloudWatch Dashboard for Fluent Bit
Follow these steps to set up the CloudWatch dashboard and visualize metrics for your EKS clusters:
Install CloudWatch Agent with Prometheus Metrics Collection for Amazon EKS Cluster. REFER : https://docs.amazonaws.cn/en_us/AmazonCloudWatch/latest/monitoring/ContainerInsights-Prometheus-Setup.html
Set Environment Variables:
- Replace the placeholder values with your deployment specifics:
    DASHBOARD_NAME=your_cw_dashboard_name
    REGION_NAME=your_metric_region_such_as_us-west-1
    CLUSTER_NAME=your_kubernetes_cluster_name
Create the Dashboard:
- Run the following command to create the dashboard:
    curl https://raw.githubusercontent.com/aws-samples/amazon-cloudwatch-container-insights/latest/k8s-deployment-manifest-templates/deployment-mode/service/cwagent-prometheus/sample_cloudwatch_dashboards/fluent-bit/cw_dashboard_fluent_bit.json \
    | sed "s/{{YOUR_AWS_REGION}}/${REGION_NAME}/g" \
    | sed "s/{{YOUR_CLUSTER_NAME}}/${CLUSTER_NAME}/g" \
    | xargs -0 aws cloudwatch put-dashboard --dashboard-name ${DASHBOARD_NAME} --dashboard-body
Access the CloudWatch Dashboard:
- Open the CloudWatch dashboard.
Expected Dashboard Appearance:
Upon successful setup, you should see a CloudWatch dashboard with the specified name, showcasing detailed metrics for Fluent Bit within your EKS clusters.
Conclusion:
Deploying Fluent Bit as a DaemonSet for CloudWatch Logs in your Kubernetes environment is a strategic move towards efficient log management. The guide provided insights into Fluent Bit configurations, setup steps, verification, and the added benefit of a dedicated CloudWatch dashboard. By following this comprehensive walkthrough, you've not only streamlined log processing but also gained real-time visibility into the health and performance of your containerized applications. Adapt the configurations to fit your needs, and enjoy an enhanced logging experience with Fluent Bit and CloudWatch.


