Harnessing the Power of AWS CloudWatch Synthetics for Proactive Application Monitoring
Introduction:
In the dynamic realm of cloud computing, ensuring the optimal performance and reliability of applications is paramount for delivering exceptional user experiences. AWS CloudWatch Synthetics has emerged as a robust solution, enabling proactive monitoring and troubleshooting by simulating user interactions. In this blog post, we'll explore the capabilities of CloudWatch Synthetics, delve into real-time use cases, and guide you through the process of creating a basic canary using the AWS Management Console.

Understanding CloudWatch Synthetics:
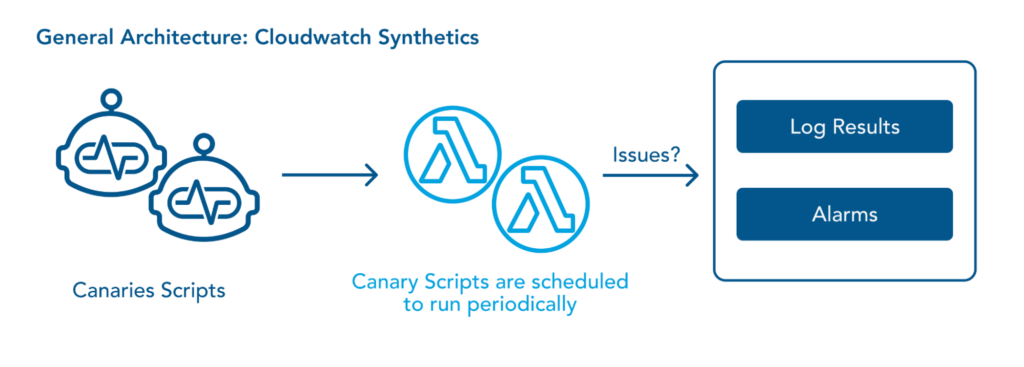
1. Unveiling CloudWatch Synthetics: AWS CloudWatch Synthetics is a service designed to monitor application health and performance by executing synthetic scripts. These scripts, known as canaries, mimic real user interactions with applications, enabling the early detection of potential issues before end-users are affected.
2. Core Features:
Canary Scripts: Simulate user interactions to monitor application behavior.
Global Coverage: Monitor applications from various geographical locations.
Customizable Monitoring: Configure canaries to run at specific intervals.
Integration with CloudWatch Alarms: Automate responses based on monitoring results.
Real-Time Use Cases:
1. Proactive Monitoring: Detect and address potential issues before impacting users by running canaries at regular intervals to simulate common user interactions.
2. Geographic Performance Analysis: Ensure optimal user experiences globally by running canaries from different AWS regions, identifying and mitigating performance disparities.
3. Continuous Integration/Continuous Deployment (CI/CD) Pipeline Monitoring: Integrate CloudWatch Synthetics into your CI/CD pipeline to validate deployments and ensure they do not degrade application performance.
4. External Service Monitoring: Monitor the availability and response times of external APIs or services critical to your application's functionality.
Creating a Basic Canary using AWS Management Console:
1. Navigate to CloudWatch:
- Access the AWS Management Console and go to the CloudWatch service.
2. Select Synthetics:
- Click on the "Synthetics" section in the left navigation pane.

3. Create a Canary:
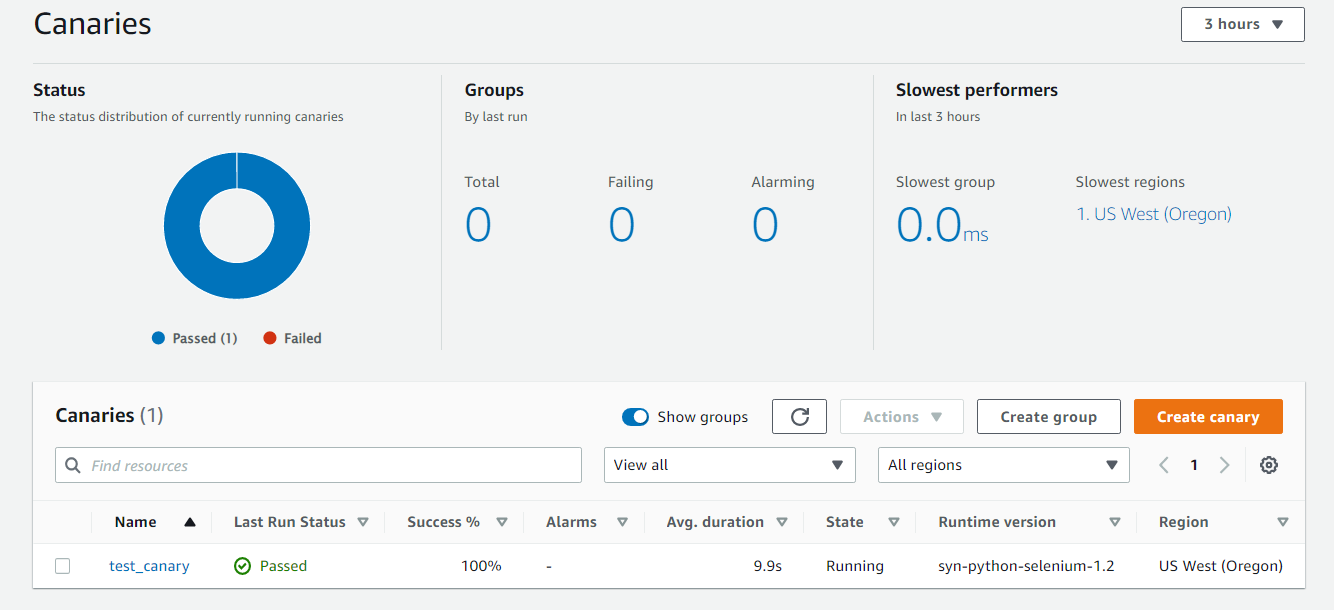
- Initiate the creation of a canary by clicking the "Create canary" button.

4. Configure Canary Details:
- Provide basic details such as name and runtime version for your canary.
5. Choose a Blueprint:
- Select a blueprint based on your use case, e.g., the "Heart Beat Monitoring" blueprint for monitoring website availability.

6. Configure Canary Script:
- Customize the canary script parameters, such as the URL to ping.
7. Set Schedule:
- Choose the frequency at which the canary should run, defining intervals or using a cron expression.
8. Configure S3 Bucket (Optional):
- Optionally configure an S3 bucket to store artifacts or screenshots generated by the canary.
9. Create Canary:
- Review your configuration and initiate the creation of the canary.
10. View Results:
- Monitor canary results, logs, and screenshots in the CloudWatch Synthetics console.

Conclusion:
AWS CloudWatch Synthetics empowers organizations to proactively monitor and enhance the performance of their applications. By leveraging canaries to simulate user interactions, businesses can stay ahead of potential issues and ensure a seamless user experience. The AWS Management Console provides an intuitive interface for creating and managing canaries, making synthetic monitoring accessible to both developers and operations teams. As the landscape of cloud computing continues to evolve, CloudWatch Synthetics stands out as a valuable tool for maintaining the reliability and performance of modern applications.
