
Kubernetes Metrics: Troubleshooting Metrics-Server Installation and Node Resource Monitoring


Introduction
Embrace the power of Kubernetes metrics with KillerCoda as you delve into troubleshooting metrics-server installation and harness its capabilities for node resource monitoring. Discover the essence of Kubernetes monitoring as we unravel the complexities of node CPU and memory utilization.
In the dynamic landscape of Kubernetes, effective monitoring of node resources is paramount for maintaining cluster health and performance. Metrics-server, an essential component, enables the collection and retrieval of vital metrics like node CPU and memory utilization, crucial for optimizing resource allocation and scaling decisions. In this guide, we delve into troubleshooting metrics-server installation and harnessing its capabilities for comprehensive node resource monitoring.
Prerequisites
Before diving into troubleshooting, ensure your Kubernetes cluster is operational and you possess a fundamental understanding of Kubernetes components and concepts.
Killercode View

Installing Metrics-Server
Deploying Metrics-Server
Install metrics-server using its deployment manifest.
kubectl apply -f https://github.com/kubernetes-sigs/metrics-server/releases/latest/download/components.yaml

Fine-Tuning Deployment
Adjust metrics-server deployment.
kubectl -n kube-system edit deployments.apps metrics-server
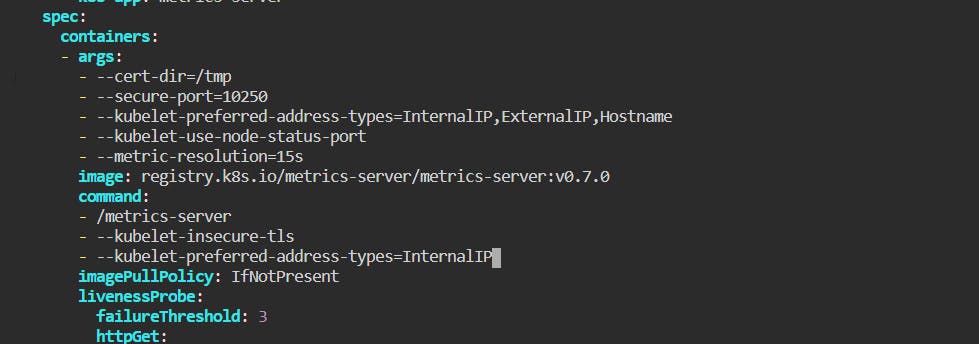
Paste the following commands in the deployment file of metrics server
command:
        - /metrics-server
        - --kubelet-insecure-tls
        - --kubelet-preferred-address-types=InternalIP
Verify that the
metrics-serverdeployment is running the desired number of Pods with the following command.kubectl get deployment metrics-server -n kube-systemAn example output is as follows.
 NAME             READY   UP-TO-DATE   AVAILABLE   AGE
 metrics-server   1/1     1            1           6m
Restarting kubelet Service
Restart kubelet to enforce configuration changes.
systemctl restart kubelet
systemctl enable kubelet
Troubleshooting Steps
1. Check Deployment Events
Inspect deployment events to identify potential issues.
kubectl describe deployment metrics-server -n kube-system
2. Verify Pod Logs
Examine pod logs for insights into errors or failures.
kubectl logs <metrics-server-pod-name> -n kube-system
3. Inspect Metrics-Server Deployment
Ensure all metrics-server pods are in the running state.
kubectl get pods -n kube-system
Utilizing Metrics-Server
1. Viewing Node Metrics
After few minutes you can Monitor the overall node resource utilization.
kubectl top nodes

2. Examining Pod Metrics
Track CPU and memory usage of pods.
kubectl top pods

3. Exploring Container Metrics
Retrieve detailed container metrics within pods.
kubectl top pods --containers=true
Conclusion
In the realm of Kubernetes, mastering metrics monitoring is indispensable for ensuring cluster efficiency and performance optimization. By troubleshooting metrics-server installation and harnessing its capabilities for node resource monitoring, Kubernetes administrators can effectively manage and scale their clusters. Empower your Kubernetes journey with robust metrics monitoring practices and unlock the full potential of your infrastructure.