


Introduction:
Amazon Elastic Kubernetes Service (EKS) makes it easy to deploy, manage, and scale containerized applications using Kubernetes. In this blog post, we will walk through the process of setting up Prometheus and Grafana on Amazon EKS to monitor your Kubernetes clusters effectively.
Prerequisites:
- An active Amazon EKS cluster.
- EKS Cluster
- kubectl installed and configured to connect to your EKS cluster.
Reference Link: docs.aws.amazon.com/eks/latest/userguide/in..
- Helm installed on your local machine.
Reference Link:helm.sh/docs/intro/install
Deploy Prometheus on EKS:
We'll use Helm, the Kubernetes package manager, to deploy Prometheus. Follow these steps:
1. Create a Prometheus namespace:
kubectl create namespace prometheus
2. Add the prometheus-community chart repository:
helm repo add prometheus-community https://prometheus-community.github.io/helm-charts
3. Deploy Prometheus:
helm upgrade -i prometheus prometheus-community/prometheus \

    --namespace prometheus \

    --set alertmanager.persistentVolume.storageClass="gp2",server.persistentVolume.storageClass="gp2"
This command upgrades the Prometheus installation named "prometheus" in the "prometheus" namespace. It sets the storage class for both Alertmanager and Prometheus Server's persistent volumes to "gp2." The storage class represents the type of storage used, often associated with specific configurations, such as Amazon EBS volume types in a Kubernetes cluster.
Make note of the prometheus endpoint in helm response (you will need this later). It should look similar to below:
The Prometheus server can be accessed via port 80 on the following DNS name from within your cluster:

prometheus-server.prometheus.svc.cluster.local
- Verify the deployment:
kubectl get pods -n prometheus
In this stage some pods are in pending stage. The reason for this is the absence of Amazon Elastic Block Store (Amazon EBS) Container Storage Interface (CSI) driver. It manages the lifecycle of Amazon EBS volumes as storage for the Kubernetes Volumes that you create.
5. Create an IAM OIDC identity provider for your cluster with the following command. [If you have an IAM OIDC provider for your cluster, then skip this step]
eksctl utils associate-iam-oidc-provider --cluster $cluster_name --approve
- Creating your Amazon EBS CSI plugin IAM role with eksctl:
eksctl create iamserviceaccount \

    --name ebs-csi-controller-sa \

    --namespace kube-system \

    --cluster my-cluster \

    --role-name AmazonEKS_EBS_CSI_DriverRole \

    --role-only \

    --attach-policy-arn arn:aws:iam::aws:policy/service-role/AmazonEBSCSIDriverPolicy \

    --approve
7. Managing the Amazon EBS CSI driver as an Amazon EKS add-on:
To improve security and reduce the amount of work, you can manage the Amazon EBS CSI driver as an Amazon EKS add-on.
- To see the required platform version, run the following command.
aws eks describe-addon-versions --addon-name aws-ebs-csi-driver
- To add the Amazon EBS CSI add-on using eksctl
eksctl create addon --name aws-ebs-csi-driver --cluster my-cluster --service-account-role-arn arn:aws:iam::111122223333:role/AmazonEKS_EBS_CSI_DriverRole --force
Replace your cluster name and AWS account number
- Check the current version of your Amazon EBS CSI add-on.
eksctl get addon --name aws-ebs-csi-driver --cluster my-cluster
Replace your cluster name. An example output is as follows.
NAME                    VERSION                      STATUS  ISSUES  IAMROLE UPDATE AVAILABLE

aws-ebs-csi-driver      v1.11.2-eksbuild.1           ACTIVE  0               v1.11.4-eksbuild
- Update the add-on to the version returned under UPDATE AVAILABLE in the output of the previous step.
eksctl update addon --name aws-ebs-csi-driver --version v1.11.4-eksbuild.1 --cluster my-cluster \

  --service-account-role-arn arn:aws:iam::111122223333:role/AmazonEKS_EBS_CSI_DriverRole --force
8. Now check the pod status
kubectl get pods -n prometheus
Output is
NAME                                             READY   STATUS    RESTARTS   AGE

prometheus-alertmanager-59b4c8c744-r7bgp         1/2     Running   0          48s

prometheus-kube-state-metrics-7cfd87cf99-jkz2f   1/1     Running   0          48s

prometheus-node-exporter-jcjqz                   1/1     Running   0          48s

prometheus-node-exporter-jxv2h                   1/1     Running   0          48s

prometheus-node-exporter-vbdks                   1/1     Running   0          48s

prometheus-pushgateway-76c444b68c-82tnw          1/1     Running   0          48s

prometheus-server-775957f748-mmht9               1/2     Running   0          48s
9. Label the Prometheus-server pod to connect it with service:
kubectl label pod <pod-name> app=prometheus
10. Expose Prometheus using a Service:
Prometheus metrics are often accessed via a web UI. We'll expose Prometheus using a NodePort service.
prometheus-deployment.yml
apiVersion: v1

kind: Service

metadata:

  name: prometheus-nodeport

  namespace: prometheus

spec:

  selector:

    app: prometheus

  ports:

    - name: web

      port: 9090

      targetPort: 9090

      protocol: TCP

      nodePort: 30000  # You can choose any available port on your nodes

  type: NodePort
11. Apply the service file:
Kubectl apply -f prometheus-deployemnt.yml
12. Note the NodePort assigned; you can access Prometheus using any node's IP with this port (e.g., http://<node-ip>:30000).
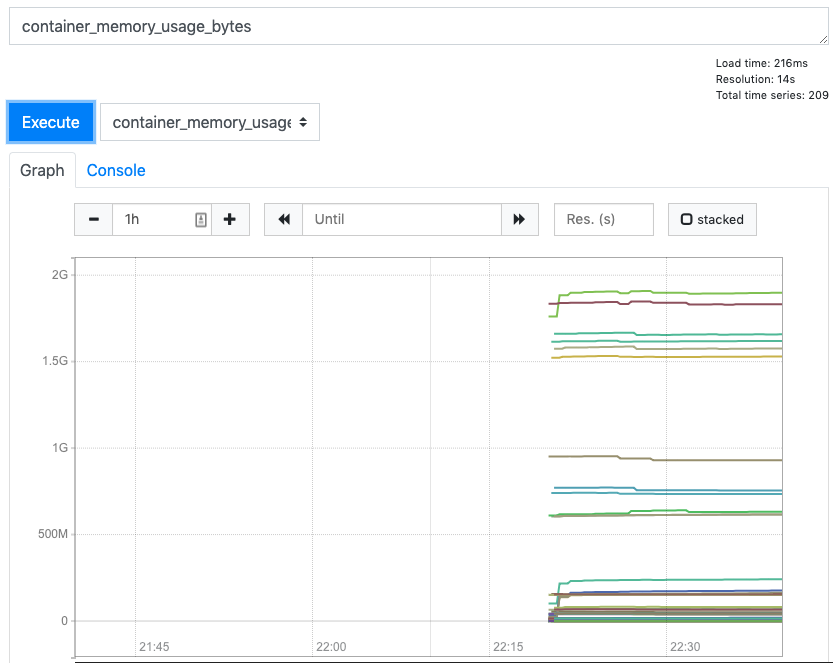
Choose a metric from the - insert metric at cursor menu, then choose Execute. Choose the Graph tab to show the metric over time. The following image shows container_memory_usage_bytes over time.
From the top navigation bar, choose Status, then Targets.
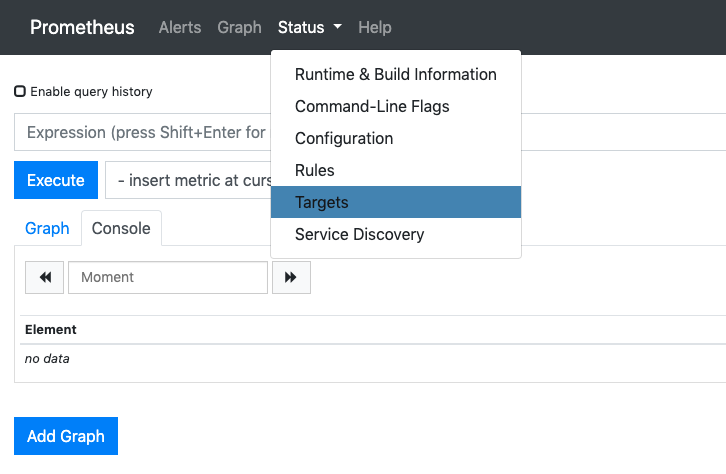
All of the Kubernetes endpoints that are connected to Prometheus using service discovery are displayed.
Refer:Creating the Amazon EBS CSI driver IAM role - Amazon EKS
Refer:Managing the Amazon EBS CSI driver as an Amazon EKS add-on - Amazon EKS
Refer:Prometheus metrics - Amazon EKS
Deploy Grafana on EKS:
Now, we'll deploy Grafana using Helm:
- Add grafana Helm repo
helm repo add grafana https://grafana.github.io/helm-charts
- Create a Grafana namespace:
kubectl create namespace grafana
3. Create YAML file calledgrafana.yamlwith following commands:
  datasources:

  datasources.yaml:

    apiVersion: 1

    datasources:

    - name: Prometheus

      type: prometheus

      url: http://prometheus-server.prometheus.svc.cluster.local

      access: proxy

      isDefault: true
Make sure you are giving the correct prometheus url
4. Deploy Grafana using Helm:
helm install grafana grafana/grafana \

    --namespace grafana \

    --set persistence.storageClassName="gp2" \

    --set persistence.enabled=true \

    --set adminPassword='EKS!sAWSome' \

    --values /home/ec2-user/grafana.yaml \

    --set service.type=NodePort
Replace the adminPassword with your strong password and give the correct path of the grafana.yaml file
5. Verify the deployment:
kubectl get pods -n grafana
Ensure that the Grafana pods are running.
- Access Grafana Dashboard:
Find the NodePort assigned to Grafana:
kubectl get services -n grafana
Access Grafana using any node's IP and the NodePort (e.g., http://<node-ip>:<nodeport>).
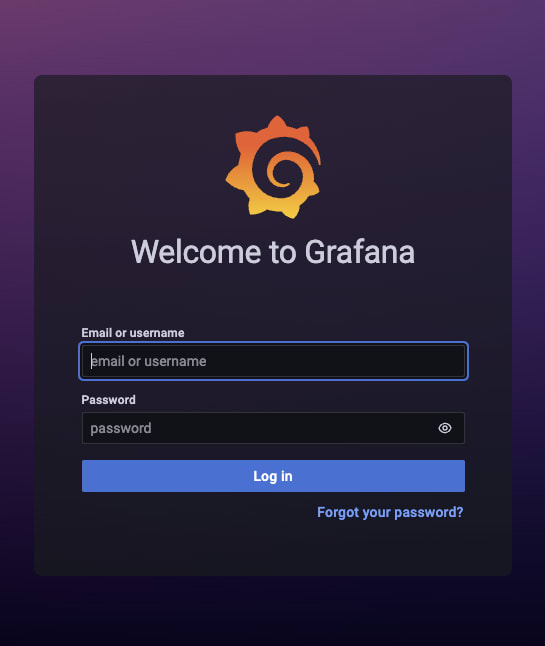
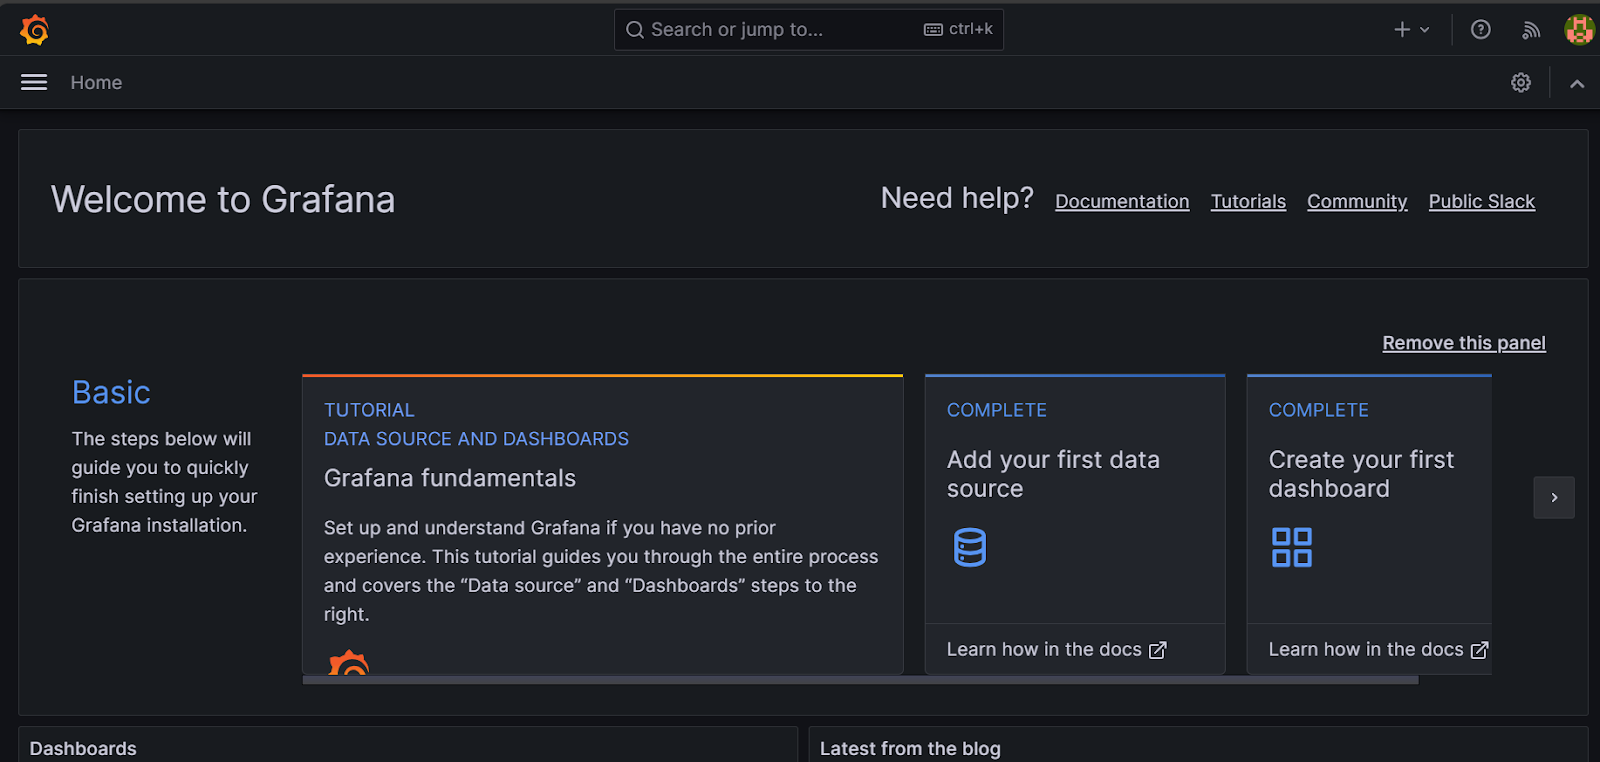
Log in to Grafana using the admin credentials set during deployment. The Default username is “admin”
Refer:Deploy Grafana :: Amazon EKS Workshop
Refer:Prereqs :: Amazon EKS Workshop
Conclusion:
You've successfully set up Prometheus and Grafana on Amazon EKS for monitoring your Kubernetes clusters. This powerful combination provides insights into your applications and infrastructure, helping you make informed decisions and ensure optimal performance. Explore further by creating custom dashboards and alerts based on your specific monitoring needs. Happy monitoring!